
How to Deposit on Deriv via Airtel Money Kenya
Understanding Deriv Charts for Better Trading Decisions
For traders in Kenya, reading price movement correctly is the difference between a guess and an informed decision. This guide breaks down how Deriv charts work, what tools are available, and how to use them to build a more disciplined trading approach on the deriv platform.

What Are Deriv Charts
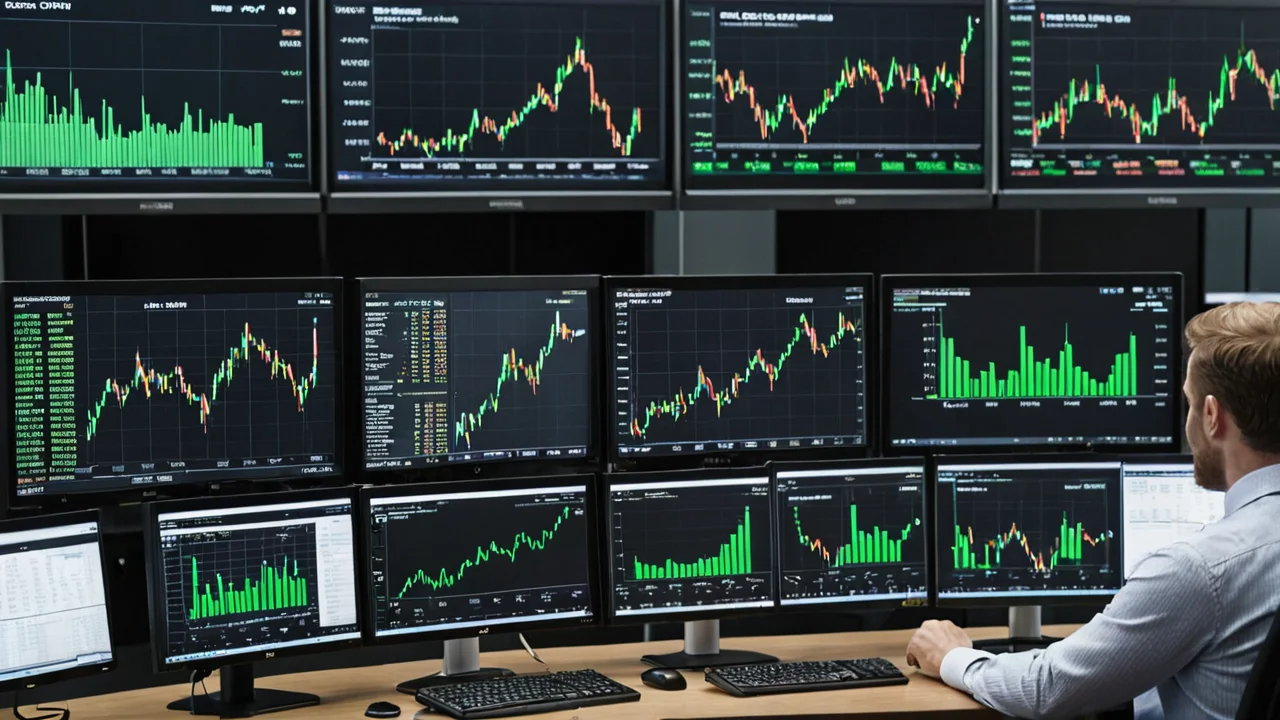
Deriv charts are the visual backbone of the platform, showing how prices for forex pairs, synthetic indices, and other instruments move over time. Instead of scrolling through raw numbers, Kenyan traders can see candlestick patterns, trend lines, and volatility swings at a glance.
The charting experience on Deriv is built around advanced charting technology, which many traders in Kenya will already recognize from other platforms since it's a widely used charting library across the industry. This means the learning curve is shorter for anyone who has dabbled in market analysis before, whether on a phone or a desktop browser.
- Real-time price updates for supported instruments
- Multiple chart types, including candlestick and line views
- Drawing tools for marking support, resistance, and trend lines
Key Takeaway: Deriv charts give Kenyan traders a familiar, TradingView-style interface for tracking price action without needing separate charting software.
Why Chart Analysis Matters for Kenyan Traders
Kenya's retail trading community has grown quickly, and much of that growth is tied to instruments like synthetic indices that trade continuously. Because these markets don't follow the same hours as traditional stock exchanges, having a reliable chart open at any hour becomes essential rather than optional.
A trader placing decisions without reviewing recent price history is essentially trading blind. Chart analysis helps identify whether a market is trending, consolidating, or showing signs of a reversal, which directly informs entry and exit timing.
It's worth remembering that Deriv operates as an offshore-regulated broker for Kenyan users, since it is not licensed by Kenya's Capital Markets Authority. That makes personal risk management, including how you use charts to time trades, even more important, because dispute resolution and investor protections work differently than they would with a locally licensed firm.
Key Takeaway: Since Kenyan accounts rely on offshore protections rather than CMA oversight, sound chart-based analysis becomes a personal risk-management tool, not just a trading nicety.
Key Features of the Deriv Analysis Tool
The analysis tools built into Deriv's charting interface go beyond simply displaying price lines. Traders can layer indicators, adjust timeframes, and compare how an instrument has behaved across different periods.
Common features Kenyan traders tend to rely on include moving averages to smooth out short-term noise, oscillators to gauge momentum, and volume-style indicators where applicable to synthetic indices. Combining two or three of these, rather than relying on just one, tends to produce steadier signals.
- Adjustable timeframes, from very short intervals to longer daily views
- Technical indicators layered directly onto the price chart
- Zoom and pan controls for reviewing historical price behavior
Many traders in Kenya start with a simple setup, such as a moving average paired with a momentum indicator, before adding complexity. Overloading a chart with too many indicators at once often creates conflicting signals rather than clarity.
How to Read Candlestick Patterns on Deriv
Candlestick charts are the default view for most Deriv users because they pack more information into a single visual than a simple line chart. Each candle shows the opening price, closing price, and the high and low reached during that period.
A green or upward-colored candle typically signals that the closing price was higher than the opening price, suggesting buying pressure during that interval. A red or downward-colored candle shows the opposite. Reading a sequence of these candles over time reveals patterns that experienced traders use to anticipate short-term moves.
Body size matters too. A long body suggests strong conviction in one direction, while a short body with long wicks often signals indecision in the market. Kenyan traders analyzing volatile instruments like synthetic indices should pay particular attention to wick length, since sharp reversals within a single candle are common on these products.
Key Takeaway: Candlestick shape and wick length often say more about market sentiment than the closing price alone.
Setting Up Your Deriv Chart for Analysis
Getting a chart configured properly takes only a few minutes but makes a noticeable difference in how useful it becomes. Start by selecting the instrument you want to analyze, then choose a timeframe that matches your trading style.
Short-term traders working with quick decisions often prefer lower timeframes, while those planning to hold positions longer benefit from daily or higher-interval views. It helps to save a preferred layout so you're not rebuilding your setup every session.
- Choose an instrument, such as a forex pair or a synthetic index
- Select a timeframe that fits your trading horizon
- Add no more than two or three indicators to avoid clutter
- Save your layout for consistent future analysis
Kenyan traders using mobile devices should also check that their connection is stable, since real-time chart data depends on a steady feed, particularly during volatile market hours.
Common Mistakes When Reading Deriv Charts
Even experienced traders fall into habits that undermine good analysis. One frequent mistake is chasing a chart pattern after it has already played out, entering a trade too late to capture meaningful movement.
Another common error is ignoring the broader trend while focusing only on a short timeframe. A price move that looks like a strong signal on a five-minute chart might be nothing more than minor noise within a larger, opposite trend. Cross-checking multiple timeframes before acting on a signal helps avoid this trap.
Overreliance on a single indicator is another pitfall. No indicator is perfect, and relying solely on one, without confirming with price action or a second tool, tends to produce more false signals than reliable ones.
Key Takeaway: Combining timeframes and confirming signals with more than one tool reduces the chance of acting on false patterns.
Using Deriv Charts Responsibly in Kenya
Chart analysis improves decision-making, but it doesn't eliminate risk. Deriv is widely used by Kenyan traders and has a long operating history dating back to its earlier identity as Binary.com, yet it remains an offshore-regulated platform without a Capital Markets Authority license for Kenyan clients.
This means account protections and any dispute resolution fall under international regulators rather than Kenyan financial authorities. Some Kenyan reviewers have also noted user complaints related to account issues, which is a reminder that good technical analysis should be paired with cautious position sizing and realistic expectations.
Before relying heavily on any chart-based strategy, it's worth practicing on a demo setup if one is available, and starting with amounts you're comfortable risking. Chart reading is a skill that improves with repetition, not something to master overnight.
Frequently Asked Questions
-
What charting technology powers Deriv charts?
A: Deriv's charting interface is built on advanced charting technology similar to TradingView, giving traders in Kenya a familiar, feature-rich experience for viewing price movement across supported instruments.
-
Can I use Deriv charts on mobile in Kenya?
A: Yes, Deriv's charting tools are accessible through mobile access alongside desktop, though specific app names and versions should be verified directly through official app store listings.
-
Are Deriv charts available for synthetic indices around the clock?
A: Synthetic indices on Deriv are known for trading continuously, which means chart data for these instruments is generally available at any hour, unlike traditional market-hour-bound assets.
-
Do I need trading experience to use Deriv's analysis tools?
A: No prior experience is strictly required, but understanding basic candlestick reading and one or two indicators makes the charting tools far more useful for making informed decisions.
-
Is Deriv regulated for traders in Kenya?
A: Deriv is not licensed by Kenya's Capital Markets Authority. It operates through international regulatory entities, so Kenyan traders should understand that local regulatory protections do not apply to their accounts.